Empower Yourself with Data Shape the Future
Rediscover Your Digital World
Transform your business with the power of data! Ensure your digital success with smart analytics and seamless setups. Access tomorrow’s solutions today.
How We Do It
We help you reach your goal on different levels by serving a competent program in paralel with your industry's variables and your needs.
Expectations & Analysis
We conduct in-depth analyses to understand your business needs and define your goals, strategically planning the path to success.
Stakeholder Meetings
At every stage of the project, we ensure effective communication with all stakeholders, meeting expectations and maintaining a transparent process.
Data Collection & Management
We collect and manage accurate data, strengthening your decision-making processes with high-quality data and providing a competitive advantage.
Documentation
We implement your systems seamlessly with clear, step-by-step, and comprehensive setup documents that provide thorough guidance.
Testing & Deployment Processes
We meticulously test all systems, minimize errors, and deploy your projects with confidence.
Reports & Insights
We visualize your data with effective reports and dynamic dashboards, providing powerful tools for real-time insights and strategic decision-making.
The Value of "Not Guessing"
Every time you take a guess, you create the possibility of risk and prejudice. That’s why here at Kriko, we turn to data before making any kind of guesses. With our “Stop Guessing!” approach, we aim to stand out from our rivals in the industry and provide permanent value to your brand.
Solutions For Every Industry
Kriko Health & Insurance
It is very important that the health sector, which appeals to a wide audience, is always at the forefront of the digital marketing game, unlike many sectors. We increase your organic visibility and brand awareness with SEO activities, which are both a legal and an efficient channel for the health sector.
Kriko
Ecommerce
The importance of SEO is an undeniable fact in the e-commerce sector, which is a very large volume sector. With online marketing strategies and SEO service, we ensure your brand to develop, grow, and increase your organic traffic volume.
Kriko Publishing & Community
We identify SEO strategies that allow you to be visible and discoverable on the Internet. This way, you can easily reach the community you want to contact, increase the traffic of your website and expand your target audience.

Kriko Banking & Finance
We offer the service you need for digital transformation, which is one of the most important issues on the agenda of the finance and banking industry. We provide digital transformation and development for the detected problems or needs.

Kriko Life & Travel
We conduct SEO studies that will enable you to reach more people at the same time and increase your sales. Thus, we ensure that your brand, services, campaign and distinctive features are more visible.

Kriko
Education
We deliver your story to your target audience with the most appropriate digital marketing methods. Thus, by increasing brand awareness, we provide trust in your target audience, evoke desire and make your brand a value for them.

Brands


Testimonials
Many leading brands from various sectors prefer Kriko for their content work. You can be inspired by the stories of brands advancing with Kriko's content strategies in their journey to success, and you can take action immediately for your own success strategies.

In line with the rising competition and market dynamics, our aim is to always deliver the product they seek to our customers with the fastest and best price advantage. It is our ultimate desire to achieve this with a good experience and process design. We cooperated with Kriko to achieve our annual targets and improve our current traffic for these purposes. We believe that Kriko will have serious added value to GittiGidiyor with its experience and competencies in the field of e-commerce.

Since we first met with the kriko, they added to us as “to apply a versatile and comprehensive road map with the right methodologies instead of the word generic consisting of general information that is said.” Accurate analysis of our brand and its dynamics, which generally have a slightly different customer behavior and are located in a difficult vertical, prove that we are not wrong in this opinion.

As GittiGidiyor (eBay Turkey), we continue on our way every year by getting more share from the market with a growth much higher than the market growth. In order for this growth to continue in a healthy way, it is critical for us to strengthen our SEO and organic traffic day by day. When choosing our business partners to work in this field, we always prefer to work with the best in the field. We chose Kriko as our business partner for our SEO operations with the confidence we have in their experience and competencies and we see that we have made a very correct decision even in the short time we spent together.

Kriko has helped us to make an important progress even in a short time with the benefits it has provided to our website and digital channels since the first day we started working. Therefore, it would be a big mistake to evaluate Kriko only under the title of an SEO company. In our opinion, Kriko; The companion of our website is a consultant in every area we need and a digital brand assistant that will always be supported in the world of search engines.

The fact that Kriko can quickly adapt to the product management methodology of the SHERPA Blog team and the knowledge of search engine compatible content rather than the power of the mainstream SEO toolsets were important in the decision phase of SHERPA Blog. SHERPA Blog, which sees the data-based decision making discipline as the main element of its management philosophy, has gained a noticeable distance in the SERP results as a result of its short-term cooperation with Kriko, led by Uğur Eskici.

It is so annoying that it is annoying to question the decisions of the doctor you work with, keeping in mind the possibility of making a mistake when you get sick, and to constantly review the decisions of the SEO consultant you work with. Since the first day I started working with Kriko, I have no doubt about their decisions. Great head comfort and focused peace. We reflect even the most radical business requirements on the air without delay and we get positive results every time.

We met Mr. Ugur in a training he gave, and then we had the opportunity to work. The reason why we chose Kriko is the synergy of Mr. Ugur, the fact that they stay only in their field of expertise, SEO instead of turning to all branches of digital, although he positions himself as an SEO expert, it is always a phone where you can get ideas for developments in the digital world on any subject. We can sort it out to be like a consultant away from you. I hope they move forward with this professional perspective and amateur spirit and we will continue to be their companions.
We Know Exactly What We Are Doing
Many leading brands from various sectors prefer Kriko for their content work. You can be inspired by the stories of brands advancing with Kriko's content strategies in their journey to success, and you can take action immediately for your own success strategies.
Global Web Traffic
In 2023, 60% of global web traffic comes from mobile devices.
Bounce Rate
The average bounce rate ranges between 45-55%, but this can vary depending on the industry.
Conversion Rate
The average conversion rate for e-commerce websites is 2.5%, while top-performing sites can achieve rates exceeding 5%.
Email Open Rate
The average email open rate ranges between 20-25%, but this can vary by industry.
Video Content
Brands that use video content on their websites gain, on average, 41% more organic traffic.
Tools We Use
We use the most effective and reliable tools in the world of search engine optimization in order to analyze your business model with a data-oriented approach, to provide the most optimal results and to create analysis that creates added value by using up-to-date statistics and data.


Success Stories
We have accomplished countless success in many different fields, including organic traffic, SEO visibility and SERP rankings, with the brands we work with so far.
Raise Your Brand's Value
Add value to your brand with our projects prepared for your needs. From higher organic traffic to visible organic growth, from more efficient processing resources to innovative and modern approaches; it is possible to reveal the true value of your brand with Kriko.
Frequently Asked Questions
In order to understand Kriko better, we have answered the most curious questions about our services and working principle!
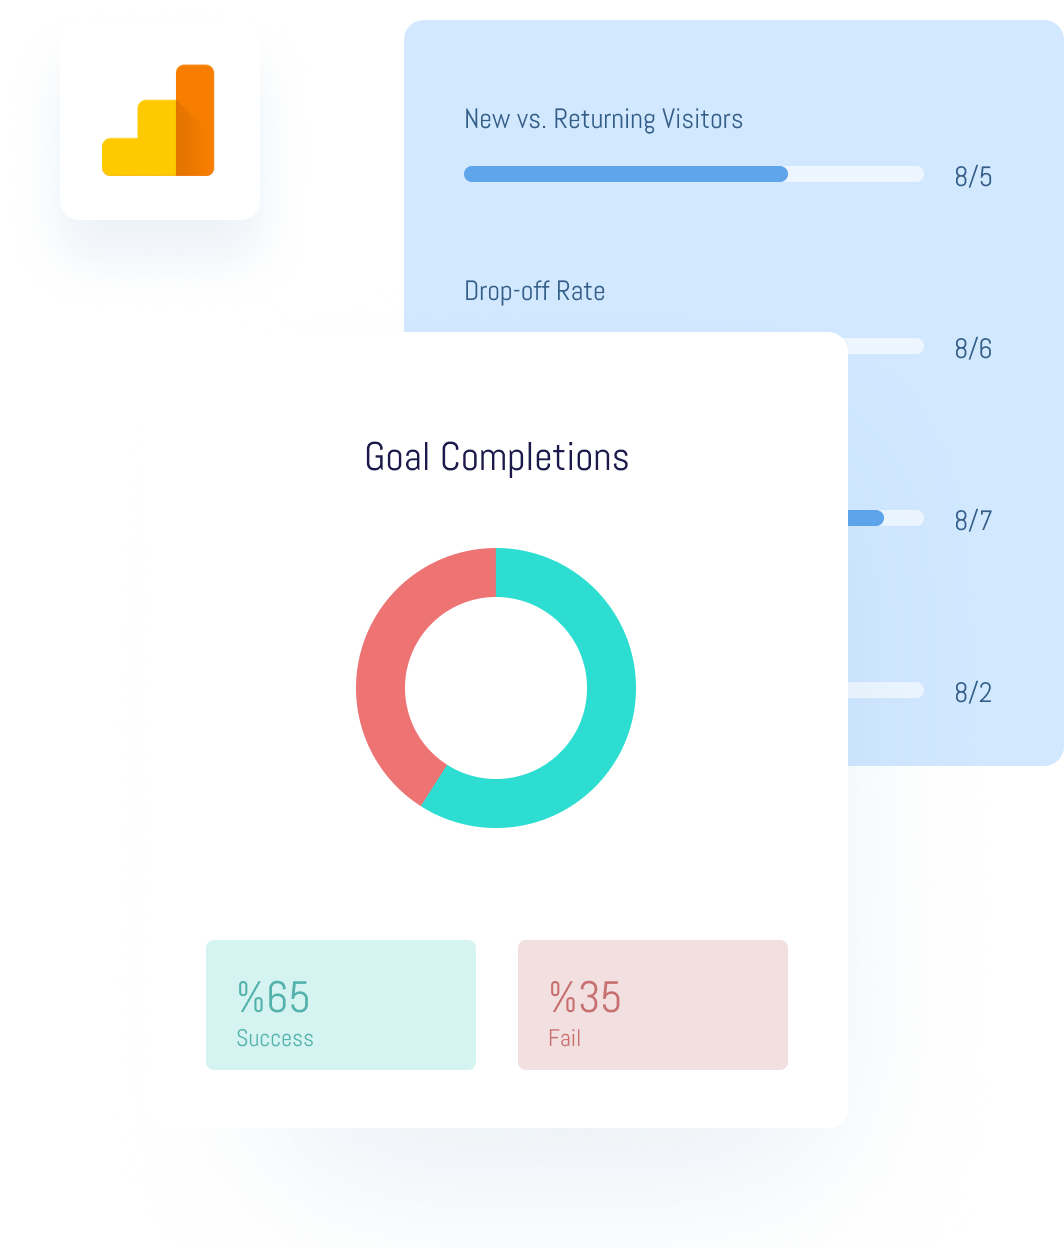
User segments in Google Analytics play a critical role in data analysis and reporting. Among the most important segments are new and returning users.
New users are those who visit your site for the first time and measure your website’s attractiveness. Returning users show visitors who return and determine the level of loyalty. Organic search users include those who find your site through search engines and measure the effectiveness of your SEO strategy. Social media referrals show traffic sources coming from social media channels and evaluate the success of your social media strategy. The mobile users segment includes visitors coming from mobile devices and tests your mobile compatibility.
A goal funnel represents the steps users take to reach a specific goal and indicates where they drop off during the process. It is a critical tool for tracking steps in e-commerce websites, from the shopping cart to the checkout page.
To create a goal funnel in Google Analytics, you first need to define a goal. Then, you must specify the pages and steps users need to go through to reach that goal. The goal funnel helps identify where users are abandoning the process and highlights areas that need improvement, ultimately allowing you to increase your conversion rates.
Session duration refers to the total time a user spends on your website, whereas time on page indicates the average time spent on a specific page. Session duration measures overall user engagement and interaction; longer session durations suggest that users find your content engaging. Time on page, on the other hand, evaluates the performance of individual pages. For example, if a blog post has a high time on page, it indicates that users are carefully reading and finding the content valuable. Both metrics are crucial for optimizing user experience and help identify areas that need improvement.
First-party cookies are cookies created by the website you visit and stored under the same domain. These cookies are used to improve the user experience and remember user preferences. For example, they store your login information or language preference.
Third-party cookies, on the other hand, are created by a different domain. They are typically used by advertisers and data analytics companies. These cookies track user behavior across different websites to deliver targeted ads.
Due to privacy concerns, third-party cookies are subject to stricter regulations and are often blocked by many browsers. Therefore, when defining your cookie management strategy, it’s important to consider these differences and respect user privacy.